|
 Note: NY NGMS will focus on IQR and "Sample Standard Deviation".
Knowing the mean, or median, of a data set yields a certain amount of information about the typical data within the set. It is possible, however, that many different data sets may have the same mean value (or median value). To determine how these data sets are different requires that we expand our investigation to obtain more information about the set. Note: NY NGMS will focus on IQR and "Sample Standard Deviation".
Knowing the mean, or median, of a data set yields a certain amount of information about the typical data within the set. It is possible, however, that many different data sets may have the same mean value (or median value). To determine how these data sets are different requires that we expand our investigation to obtain more information about the set.
One additional investigation is the examination of the measure of spread of the data set.
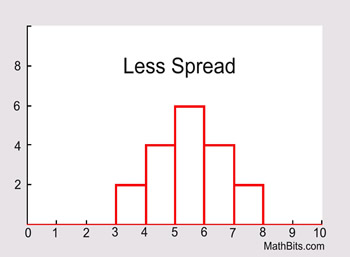
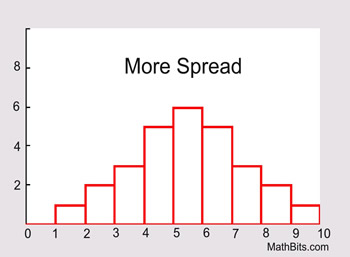
How is the data "spread out"?
|
A measure of spread (variability, dispersion, scatter) refers to how the data within the set is "spread out" (or "dispersed", or "scattered") about the mean. |
|
If the data is clustered around the center value, the "spread" is small.
The further the distances of the data values from the center value, the greater the "spread".
Measures of Spread |
May also be called: Measures of Variability,
Measures of Dispersion, or Measures of Scatter
|
|
 Range: Range:
The first method of measuring "spread" of a data set that you learned was finding the range. Range is the difference between the largest data value and the smallest data value in the set. While the range is simple to compute, it is often unreliable as a measure of
variability. The range is based on only two values within the set, which may tell very little about "how" the remaining values are distributed in the set. For this reason, range is used as a supplement to other measures of spread, instead of being the only measure of spread.
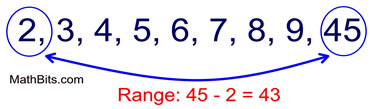
This range of 43 tells us very little about how the data in this
set is scattered.
The range alone cannot tell us, for example, if the data is clustered to one end of the set,
or if there
is an outlier in the data set. |
|
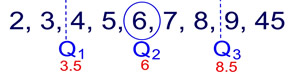
Interquartile Range (IQR): (Read more about IQR)
The interquartile range is another form of range which divides the set into four equal parts (or quarters). The three values that form the four divisions are called quartiles: first quartile, Q1; second quartile (median), Q2, and third quartile, Q3. The interquartile range is the difference between the third quartile and the first quartile. You can think of the IQR (also called the midspread or middle fifty) as a "range" between the third and first quartiles. The IQR is considered a more stable statistic than the typical range of a data set, as seen in the first section. The IQR contains 50% of the data, eliminating the influence of outliers.
|
|
|
For calculator help with
IQR from
5 number summary
click here.
|
|
|
For the following methods, you need to understand "population" vs "sample" data.
Unlike range and interquartile range, these methods utilize all of the values in a data set
to produce a measure of spread.
|
Mean Absolute Deviation (MAD): (Read more about MAD)
The mean absolute deviation is the average (mean) of the absolute value of the differences between each piece of data in the data set and the mean of the set. It measures the average distances between each data element and the mean.
Process: (1) Find the mean (average) of the set. (2) Subtract each data value from the mean to find its distance from the mean. (3) Turn all distances to positive values (take the absolute value). (4) Add all of the distances. (4) Divide by the number of pieces of data (for population MAD).
Variance: (Read more about Variance)
The variance is the average of the squared differences from the mean. A small variance indicates that the data points tend to be very close to the mean and to each other A high variance indicates that the data points are very spread out from the mean and from each other. One problem with the variance is that it does not have the same unit of measure as the original data. For example, original data containing lengths measured in feet has a variance measured in square feet.
The process is very similar to finding the MAD. The only difference is the squaring of the distances.
Process: (1) Find the mean (average) of the set. (2) Subtract each data value from the mean to find its distance from the mean. (3) Square all distances. (4) Add all the squares of the distances. (4) Divide by the number of pieces of data (for population variance).
Note: the notation used to represent "variance" is actually the square of the notation for standard deviation. The notation always reminds us of the relationship between these two quantities.
|
For calculator help with variance and standard deviation
click here. |
|
|
|
For calculator help with
variance
with grouped data
click here. |
|
|
Standard Deviation: Read more at Standard Deviation and Calculating Standard Deviation.
Note: NY NGMS will focus on the "Sample Standard Deviation".
The standard deviation is the average distance of each data point from the mean. The standard deviation is the square root of the variance. Taking the square root will return the same units as expressed in the original data, thus eliminating this problem as found with variance. Now, original data containing lengths measured in feet has a standard deviation measured in feet.
A low standard deviation indicates that the data points tend to be very close to the mean. A high standard deviation indicates that the data points are spread out over a large range of values.
The process is simply square rooting the variance. The process for finding variance is shown above.
Process: Find the square root of the variance
|
For calculator help with spread-sheet & standard deviation
click here. |
|
|
|
For calculator help with variance and standard deviation
click here. |
|
|
|
For calculator help with standard deviation with grouped data
click here. |
|
|

Which methods work best?
Symmetrical data
spread is best summarized by:
MAD, variance, and
Standard Deviation
FYI: The standard deviation is affected more by values with large deviations from the mean (more spread) than is the MAD. |
Skewed data
spread is best summarized by:
range and
IQR |
|
Don't ROUND too soon! When working with the formulas for MAD, variance and standard deviation, be careful to avoid rounding too soon. If calculating by hand, always carry more decimal places within the calculations than is expected for the final result. If working with a calculator, carry the full value of the calculator entries until you arrive at the final result.
|
|
NOTE: The re-posting of materials (in part or whole) from this site to the Internet
is copyright violation
and is not considered "fair use" for educators. Please read the "Terms of Use". |
|