Note: Note: NY NGMS will focus on the " Sample Standard Deviation".
 Standard Deviation Standard Deviation |
Let's take a look at a simple problem to solve for variance and standard deviation, done without a calculator.

Aunt Martha is measuring the heights of 6 different flowers in her garden, in inches. These heights represent the tallest plants within each of her 6 varieties of flowers.
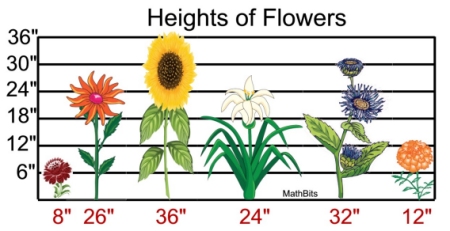
a) Find the mean height of the 6 flowers. 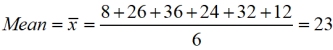 " "
b) Find the variance of the this data.
Remember, the variance is the average of the squared differences from the mean.
Subtract the mean from each height, square that value, add the results, divide by the number of flowers to get the average..
Subtract mean from
each height:
8 - 23 = -15
26 - 23 = 3
36 - 23 = 13
24 - 23 = 1
32 - 23 = 9
12 - 23 =-11
|
Square the differences (in the left column).
Add these squares.
Find the average by dividing by 6.
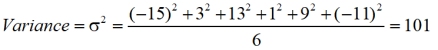
The variance is 101 square inches
|
One problem with the variance is that it does not have the same unit of measure as the original data. In this problem, the original heights were measured in inches, but the variance is measured in square inches.
c) Find the standard deviation to the nearest inch.
Remember, the standard deviation is the square root of the variance.
We will be using the population standard deviation here. Aunt Martha will not be using this data to predict the heights of plants in other people's flower beds. So, Aunt Martha's data is not a "sample", it is her ENTIRE "population".

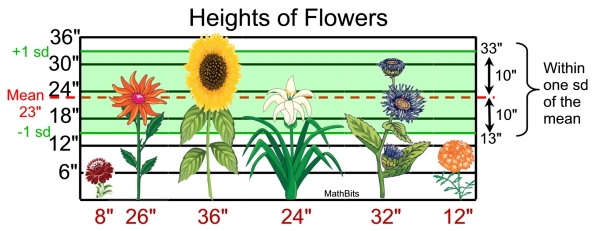
Notice: The heights were measured in inches, and the standard deviation is measured in inches.
|
Don't ROUND too soon! When working with the formula for standard deviation, be careful to avoid rounding too soon. When calculating by hand, always carry more decimal places within the calculations than is expected for the final result. If working with a calculator, carry the full value of the calculator entries until you arrive at the final result.
|
|

So, now we have seen what the process of finding a standard deviation entails. And, yes, it involves a lot of computations, especially if you are working with a large data set.
Well, good news!!!
In Algebra 1, you will be using your graphing calculator to calculate standard deviation.
How to Calculate Standard Deviation
on a Graphing Calculator |
|
TI-84+ family
of calculators |
Let's do Aunt Martha's problem again using a calculator.
(final rounding will be to two decimal places)
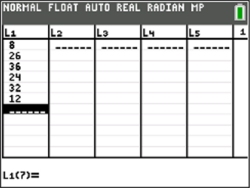
1. Place your data in a LIST.
Enter the data, as is, into L1.
You can enter the list on the home screen and "store" to L1, or you can go directly to L1 (2nd STAT, #1 Edit) to enter data. |
 |
2. To find standard deviation: Since this question deals with only Aunt Martha's flowers, this data is not a "sample". It is Aunt Martha's ENTIRE "population".
 NOTE! The standard deviations found in the CATALOG, stdDev, and also found by 2nd LIST → MATH #7 stdDev are both Sample standard deviations. NOTE! The standard deviations found in the CATALOG, stdDev, and also found by 2nd LIST → MATH #7 stdDev are both Sample standard deviations.
CATALOG
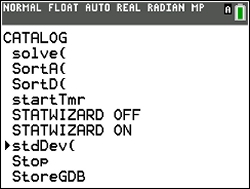
or 2nd LIST
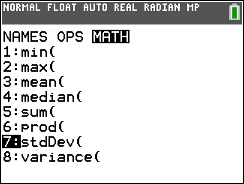
both give "sample" results.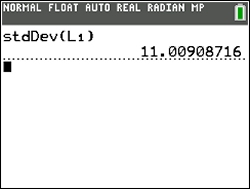
For this example:
Population Standard Deviation( σ x)
= 10.05
Sample Standard Deviation (Sx)
= 11.01 |
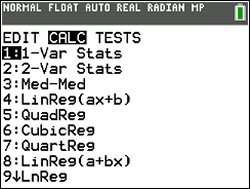
Go to one-variable stats.
STAT → CALC #1 1-Var Stats
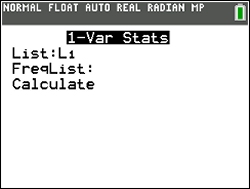
Hit ENTER after L1, Leave FreqList blank.
Hit Enter for Calculate.
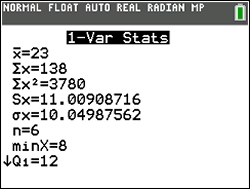
Here is all of the data you will need.
|
= mean
|
 |
= sum of the data
|
 |
= sum of squares of the data
|
|
= sample standard deviation
|
|
= population standard deviation
|
n |
= sample size (# of pieces of data)
|
minX |
= smallest data entry (minimum)
|
|
= first quartile
|
Med |
= median (second quartile)
|
|
= third quartile
|
maxX |
= largest data entry (maximum) |
|
| Formulas for Standard Deviation |
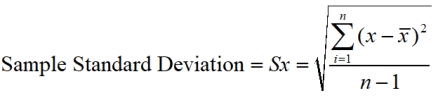
Remember that the standard deviation is the square root of the variance.
You may also see the formulas written in a single fractional form such as:
To compute standard deviation by hand:
The standard deviation is simply the square root of the variance.
This description shows computing population standard deviation and computing sample standard deviation.
Notice that for sample standard deviation, there is division by n - 1, while for population the division is by n.
Since standard deviation is the square root of the variance, we must first compute the variance. |
| Steps: |
Population Data |
Sample Data |
1. Find the mean. |
|
|
2. Subtract the mean from each data value and square each of these differences (the squared differences). |
|
|
3. Find the average of the squared differences (add them and divide by the count of the data values, n, for population, n - 1 for sample). This will be the variance. |
 variance
 |
 variance
 |
4. Take the square root. This will be the population standard deviation, or the sample standard deviation. Round the answer according to the directions in the problem. |
 standard deviation
 |
 standard
deviation |
|