|
Directions: These questions deal with box and whisker plots and quartiles.
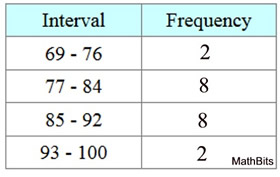
1. The distribution of exam grades for 20 students is shown below.
(a) Which interval contains the first (Q1) quartile?
(b) Which interval contains the third (Q3) quartile?
(c) Students obtaining a grade of at least 85 on this exam are exempt from making test corrections. What percent of the students will not be making corrections?
|
|
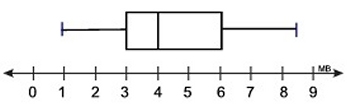
2. Jason saves a portion of his salary from his part-time job in the hope of buying a used car. He recorded the number of dollars he was able to save over the past 10 weeks.
Dollars saved: 30,
24, 25, 26, 23, 23, 28, 29, 30, 32 
Which box and whisker plot represents this data?
Choose:
|
|
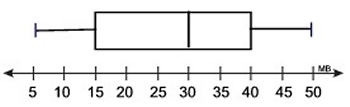
3. Examine the box plot: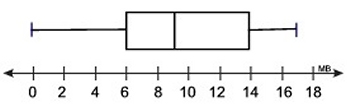 
(a) What is the value of the third quartile?
(b) What is the median score?
(c) What percent of the values are less than 6?
(d) What is the range of the data presented in the box plot?
|
|
4. |
The heights, in inches, of 16 students are shown below.
53, 55, 59, 59, 60, 61, 63, 64,
64, 65, 68, 68, 69, 72, 74, 74
|
 |
(a) What is the value of the median?
(b) What is the third (upper) quartile?
(c) What percent of the students are shorter than 5 feet 6 inches?
|
|
5. Raffle tickets were being sold in the month of September, prior to the Monster Truck Rally. The number of tickets sold, in hundreds, each day were recorded and displayed by the box plot below. |
  Determine whether the following statements are TRUE or FALSE regarding this box plot.
 |
| |
TRUE |
FALSE |
25% of the data is between 300 and 400 |
|
the second quartile is 600 |
|
the median is 400 |
|
the first quartile is 300 |
|
the range is 300 |
|
50% of the data is between 300 and 600 |
|
|
|
6. The box plot shows the ages of people attending a music concert.
(a) Which interval contains exactly 50% of the ages?
(b) What percentage of the ages are 15 or older?
(c) What is the median age?
|
|
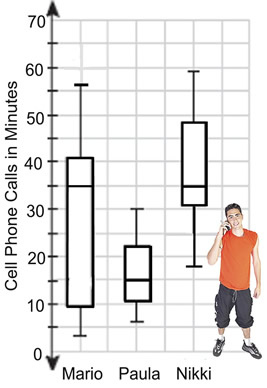
7. The box plot shows the lengths of cell phone calls made by three students in a one week period.
Which of the following statements is true?
Choose:
|
|
|
8. Examine the box plot: 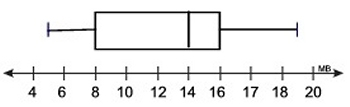

(a) Which interval represents the interquartile range, IQR?
(b) What percentage of the data lies in the IQR?
(c) Which interval could be described as being the most "clustered" section of the data?
|
|

NOTE: The re-posting of materials (in part or whole) from this site to the Internet
is copyright violation
and is not considered "fair use" for educators. Please read the "Terms of Use". |
|