Let's take a look at a couple of examples first, and then look at the details.
 A survey was conducted on a randomly selected number of grade 7 and grade 8 students, asking the question, "Do you prefer snowboarding or skateboarding?" The results are shown below.
Students |
snowboarding |
skateboarding |
Total |
Grade 7 |
130 |
110 |
240 |
Grade 8 |
140 |
120 |
260 |
Total |
270 |
230 |
500 |
Notice that the TOTALS are shown at the right and at the bottom of the table. You simply ADD across and down the table to find the totals.
Questions:
• How many students were involved in the survey? 500
• How many grade 8 students were involved in the survey? 260
• How many of the students chose snowboarding? 270
• What fractional part of the grade 7 students chose skateboarding? 110/240
 A survey was conducted on a randomly selected number of grade 7 and grade 8 students, asking the question, "Do you normally sleep "8 or more hours" or "less than 8 hours""? The results are shown below.
 Not all two-way tables supply you with the TOTAL row and column. Just remember that you can always supply these total values by simply adding the rows and columns.
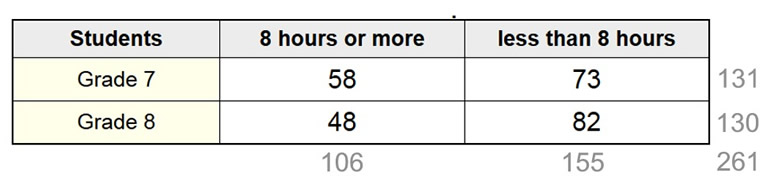
Notice that the TOTALS have been added (in gray).
Questions:
• How many students were involved in the survey? 261
• How many grade 8 students were involved in the survey? 130
• How many of the students answered "8 hours or more"? 106
• What fractional part of the grade 7 students answered "less than 8 hours"? 73/131
You can see the need for having those TOTAL values.

Now, to the details:
Two-Way Frequency Table: (displays "counts") |
A two-way table will deal with two variables (referred to as bivariate data). In so doing, these tables examine the relationships between the two categorical variables. Two-way frequency tables are especially important because they are often used to analyze survey results. Two-way frequency tables are also called contingency tables.
 The Basics of a Two-Way Frequency Table |
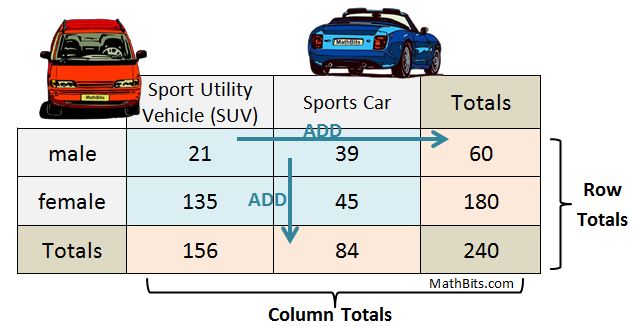
Two-way frequency tables are a visual representation of the possible relationships between two sets of categorical data. The categories are labeled at the top and the left side of the table, with the frequency (count) information appearing in the four (or more) interior cells of the table. The "totals" of each row appear at the right, and the "totals" of each column appear at the bottom.
Note: the "sum of the row totals" equals the "sum of the column totals" (the 240 seen in the lower right corner). This value (240) is also the sum of all of the counts from the interior cells.
A survey asked, "If you could have a new vehicle, would you want a sport utility vehicle or a sports car?
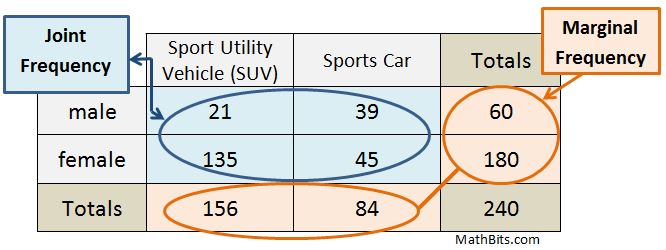
Let's take a look at the vocabulary used to identify cell locations in two-way frequency tables. Entries in the body of the table (the blue cells where the initial counts appear) are called joint frequencies. The cells which contain the sum (the orange "Totals" cells) of the initial counts by row and by column are called marginal frequencies. Note that the lower right corner cell (the total of all the counts) is not labeled as a marginal frequency.
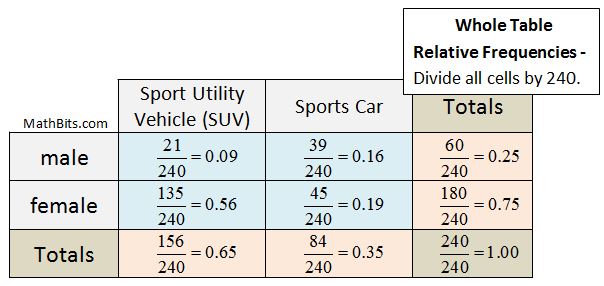
Two-Way Relative Frequency Table: (displays "percentages") |
When a two-way table displays percentages or ratios (called relative frequencies), instead of just frequency counts, the table is referred to as a two-way relative frequency table. These two-way tables can show relative frequencies for the whole table, for rows, or for columns. Notice that the relative frequencies may be displayed as a ratio, a decimal (to nearest hundredth), or percent (to nearest percent).
Relative Frequency for Whole Table: |
|
|
If the two-way relative frequency is for the whole table, each entry in the table is divided by the total count (found in the lower right corner). The ratio of "1", or 100%, occurs only in the cell in the lower right corner.
Each of the main body cells (blue) is telling you the percentage of people surveyed that gave that response (based upon the total number of people responding).
There are relative frequencies applied specifically to rows, or to columns (instead of to the whole table). You will investigate this additional approach in Algebra 1. But, for right now, we will concentrate on just the two-way frequency table (count) and the two-way relative frequency table (percentage of whole table).
|
What Two-Way Tables Tell Us: |
A variety of questions can be answered by examining a two-way frequency table.
Let's look at some possibilities:
Two-way frequency table
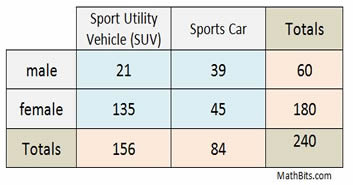
How many people responded to the survey? 240
How many males responded to the survey? 60
How many people chose an SUV? 156
How many females chose a sports car? 45
How many males chose an SUV? 21
|
Two-way relative frequency table
(whole table)
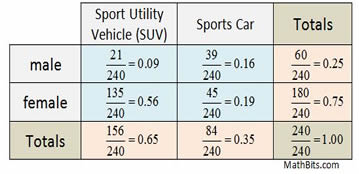
What percentage of the survey takers was female? 75%
What is the relative frequency of males choosing a sports car?
Was there a higher percentage of males or females
choosing an SUV?
higher percentage of females
|