The term "story graph" is usually applied to graphs that are composed of several line segments ( or curves) that represent what occurs during the time frame of a story.
You will learn in future courses that graphs of this nature are called piece-wise defined functions or split-definition functions.
Drawing a Graph to Tell a "Story":
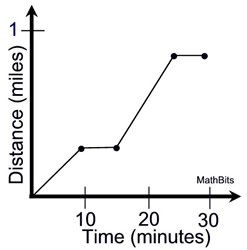
STORY: In a half hour time frame, Grandpa Joe walks for 10 minutes, rests for 5 minutes, jogs for 10 minutes, and rests for 5 minutes.Grandpa Joe will walk less than one mile during this time.
Produce a graph that could represent the distance traveled by Grandpa Joe over the 30 minute time period.
Notice:
• a horizontal segment = resting (no distance traveled)
• walking is slower than jogging
• the slope (rate of change) when walking is less than the slope (rate of change) when jogging
• in the 30 minutes, Grandpa Joe did not quite travel one mile.
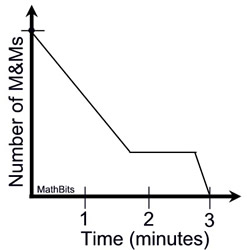
Telling a "Story" About a Graph:
Given the graph at the left, write a story that could describe what is happening as displayed by the graph.
POSSIBLE STORY: John is steadily eating from a large bag of M&M candies for nearly 2 minutes, then stops to tweet a message, then finishes off the bag of candies.
Of course, there are other possible stories.
NOTE: There-posting of materials(in part or whole) from this site to the Internet
is copyright violation
and is not considered "fair use" for educators. Please read the "Terms of Use".