|
Directions: These questions pertain to working with and interpreting graphs.
1. |
A canned cat food advertises that the food contains 20% chicken. Which graph represents the number of ounces of the chicken, y, contained in x ounces of the canned cat food? |
|
|
2. |
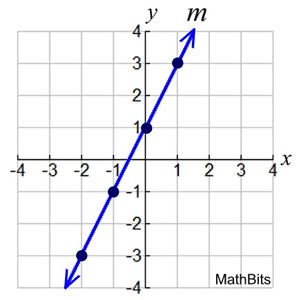
a) What is the slope of line m?
Choose:
b) What is the y-intercept of line m?
Choose:
|
 |
| |
c) Another line k (not graphed above) has the same slope as line m and passes through the point (0,6). Which table shown below represents 3 points on line k?
Choose:
|
| |
d) Which equation could represent line k?
Choose:
|
|
3.
|
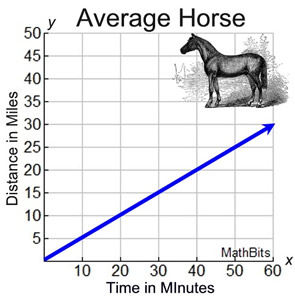
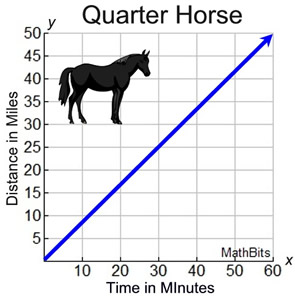
Different horses have the capacity to run at different speeds. Quarter Horses, for example, have the ability to run at very fast speeds for short distances. The graphs below show the distances that could be traveled by horses if they could constantly run at their top speed (which of course, they cannot do).
|
| |
|
|
A race horse is one of the fastest running horses in the equine world. The equation used to illustrate the distance traveled by a race horse running constantly at top speed is y = 0.73x, where y is the distance in miles and x is the time in minutes. Which of the following inequalities accurately compares the top running speeds of average horses, quarter horses, and race horses based upon this data (from slowest runner to fastest runner)?
Choose:
|
|
4. |
Omar lives on a hill. His garage is 10 feet above, and 100 feet back, from the road in front of his home. |
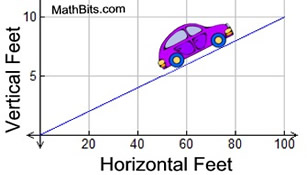 |
a) What is the slope of his driveway?
Choose:
|
b) Which equation could be used to model Omar's driveway?
Choose:
|
c) If Omar places a light pole on the edge of the driveway at a distance of 40 horizontal feet back from the road, how far above the road will the pole be placed (in feet)?
Choose:
|
|
5.
|
A paint color mixture adds 2.5 ounces of blue dye for every gallon of white paint. Which graph represents the relationship between the amount of blue dye and the amount of white paint? |
|
|
6.
|
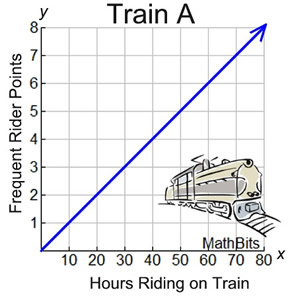
Two different train lines offer "frequent rider bonus points" based upon the number of hours a passenger spends riding on the train. Their offerings are shown in the graph and the chart below.
|
| |
|
Train B
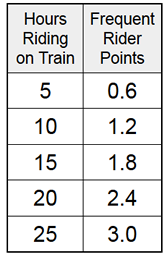 |
Which statement describes the differences regarding "frequent rider bonus points" if a passenger rides for 550 hours?
Choose:
|
|
7. |
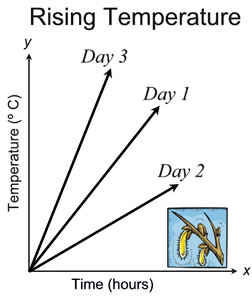
In early spring, outdoor temperatures rise at different rates from day to day. The graph at the right shows the rise of temperatures over 8 hours on three days starting at freezing (0 º C) at 6 AM.
The rising temperature on Day 1 can be represented by the equation y = 1.52x, where the temperature rose y º C in x hours. |
|
| |
Which equations could be used to represent the rising temperatures for Day 2 and Day 3?
Choose:
|
|
8. |
|
Drone B
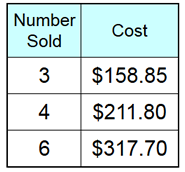 |
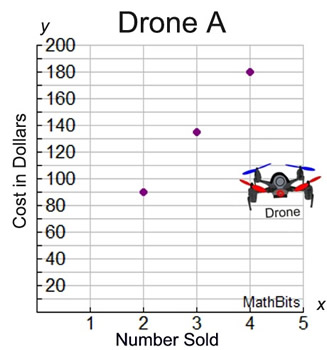
The graph and the table above show the sales of two styles of drones.
a) Assume that 150 drones of each style are sold in one week. By how many dollars will Drone B out-sell Drone A at the end of one week?
|
| b) Twenty Drone B's are sold. What is the minimum number of Drone A's that will need to be sold to surpass, in dollars, the 20 sales of Drone B?
|
|
9. |
a) Adding sugar to water raises the boiling point of the water. The effect is linear in that every additional gram of sugar has the same effect on the boiling point of a liter of water. Adding 1 gram of sugar increases the boiling point of 1 liter of water by 0.94º F.
Graph this situation using axes as shown at the right and label the line as SUGAR. |
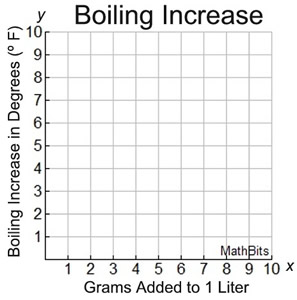 |
| |
b) Julie does an experiment to find out if the boiling point increases if salt is added to water. She discovers that adding 1 gram of salt increases the boiling point of 1 liter of water by approximately 0.56º F. On the same set of axes, graph these results and label the line SALT. Assume this situation is also linear.
|
| |
c) State the slopes of the SUGAR and SALT lines. How do the slopes compare? |
| |
d) Water boils at 212º F.
i) What is the boiling point of 1 liter of water if 6 grams of sugar are added?
ii) What is the boiling point of 1 liter of water if 3 grams of salt are added?
|
|
10. |
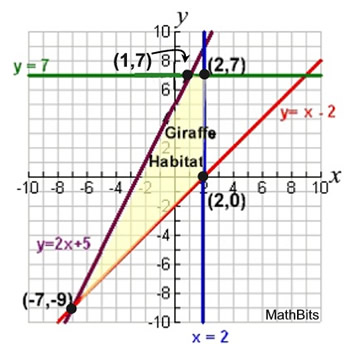
The zoo is erecting a new habitat for the giraffes. A model of the habitat can be drawn using the equations:
y = 2x + 5
y = x - 2
x = 2
y = 7 |
 Giraffe Habitat
 |
| |
The graph of the habitat is shown at the right.
Find the area of the shaded quadrilateral habitat
in square units.
|
|
|

NOTE: The re-posting of materials (in part or whole) from this site to the Internet
is copyright violation
and is not considered "fair use" for educators. Please read the "Terms of Use". |
|