|
Directions: Read carefully..
1. |
As you breathe in and out, the volume of air in your lungs is changing.
This change can be modeled by a sine curve. A medical study wants to
study the differences in the volume of air for patients at rest compared
to patients who take a deep breath. When examining the graphs, should
the study focus on the amplitude, period, or the midline? Explain. |
|
|
2. |
A team of biologists have discovered a new creature in the rain forest. They note the temperature of the animal appears to vary sinusoidally over time. A maximum temperature of 125º occurs 15 minutes after they start their examination. A minimum temperature of 99° occurs 28 minutes later. The team would like to find a way to predict the animal’s temperature over time in minutes. Your task is to help them by creating a graph of one full period and an equation of temperature as a function over time in minutes. |
|
|
3. |
Given the following equations, determine the amplitude, period, horizontal shift, and vertical shift of each equation.
Are these two equations equivalent? Support your answer graphically and algebraically.
|
|
|
4. |
The number of hours of daylight measured in one year in Ellenville can be modeled by a sinusoidal function. During 2006, (not a leap year), the longest day occurred on June 21 with 15.7 hours of daylight. The shortest day of the year occurred on December 21 with 8.3 hours of daylight. Write a sinusoidal equation to model the hours of daylight in Ellenville. |
|
|
5. |
The temperature in an office is controlled by an electronic thermostat. The temperatures vary according to the sinusoidal function:
where y is the temperature (ºC) and x is the time in hours past midnight.
a.) What is the temperature in the office at 9 A.M. when employees come to work?
b.) What are the maximum and minimum temperatures in the office?
|
|
|
6. |
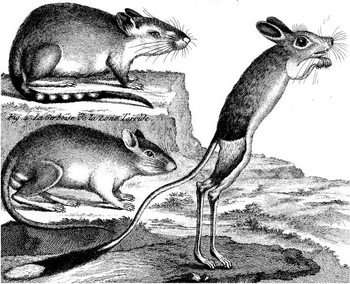
A pet store clerk noticed that the population in the gerbil habitat varied sinusoidally with respect to time, in days. He carefully collected data and graphed his resulting equation. From the graph, determine the amplitude, period, horizontal shift and vertical shift. Write the equation of the graph.
|
| |
|
|
7. |
Write both a sine and a cosine equation for the following wave graph.
|
|
| |
|
|
8. |
Environmentalists use sinusoidal functions to model populations of predators and prey in the environment. In a particular study, the population of rabbits was modeled by the function
 The population of wolves in the same environmental area was modeled by the function
In each formula, x represents time in months.
Using the graphs of these two equations, make a statement regarding the relationship between the number of rabbits and the number of wolves in this environmental area.
|
|
|
9. |
The angle of inclination of the sun changes throughout the year. This changing angle affects the heating and cooling of buildings. The overhang of the roof of a house is designed to shade the windows for cooling in the summer and allow the sun's rays to enter the house for heating in the winter.
The sun's angle of inclination at noon in central New York state can be modeled by the formula:
where x is the number of days elapsed in the day of the year, with January first represented by x = 1, January second represented by x = 2, and so on.
Find the sun's angle of inclination at noon on Valentine's Day.
Sketch a graph illustrating the changes in the sun's angle of inclination throughout the year. On what date of the year is the angle of inclination at noon the greatest in central New York state?
|
| |
|
|
10. |
A sine curve is used to model household voltage. The maximum voltage is 120 volts, and there are 60 cycles per second. Which of the following equations best represents the value of the voltage as it flows through the household, where t is time in seconds? Explain how you made your choice.
1) V = 120 sin(t)
2) V = 120 sin (60t)
3) V = 120 sin (60πt)
4) V = 120 sin (120πt) |
|
|

NOTE: The re-posting of materials (in part or whole) from this site to the Internet
is copyright violation
and is not considered "fair use" for educators. Please read the "Terms of Use". |
|