|
Exponential functions were studied in Algebra 1.
In Algebra 2, we will refresh and expand upon those previous skills.
Exponential functions are unique
in that their variable x is an exponent. |

 Linear: y = mx + b Linear: y = mx + b
y = x + 1
|
Remember:
Linear functions (y = mx + b)
involve repeated addition.
When x increases by 1, the slope, m,
is added to the y-value.
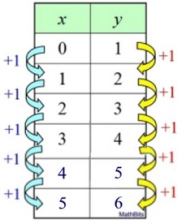
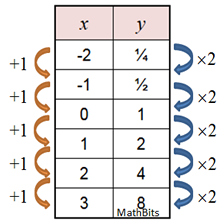
Exponential functions (y = a(b)x)
involve
repeated multiplication.
When x increases by 1, the y-value gets multiplied by a constant factor b.
|
 Exponential: y = a(b)x Exponential: y = a(b)x
y = 2x
|
Note: In a linear function, the "rate of change" remains the same across the entire graph.
In an exponential function, the "rate of change" increases (or decreases) across the graph.
|
An exponential function is a function having a positive constant as its base and a variable as its exponent (or part of its exponent).
Form: f (x) = a(b)x where a is a real number (a ≠ 0),
b is positive (b ≠1), and x is a real variable.
May also be written as: f (x) = abx
The "parent function" is f (x) = bx where a is 1.
|
|
• If b = 1, the result is a horizontal straight line (a constant function).
which does not possess the properties of growth or decay of an exponential function.
• The base b of the function cannot be negative, as complex numbers may result. (-4)½=2i.
Let's examine
some familiar graphs:
Consider y = bx.
You have worked with functions such as y = 2x,
y = 3x, and y = 0.5x.
The base value of b
may be referred to as the common factor or
"multiplier".
It is also known as the
growth factor.
Note: b is not the rate of change or growth rate.
"Rate of change" is not a constant in an exponential function.
|
x |
f (x) = 2x |
-2 |
2-2 = ¼ |
-1 |
2-1 = ½ |
0 |
20 = 1 |
1 |
21 = 2 |
2 |
22 = 4 |
3 |
23 = 8 |
| 10 |
210 = 1024 |
The rate of change from x = 0
to x = 1 is Δy / Δx = 1 / 1 = 1.
The rate of change from x = 2
to x = 3 is Δy / Δx = 4 / 1 = 4. |
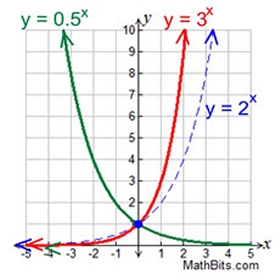
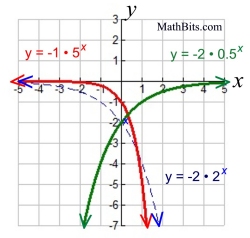
Most exponential graphs resemble
this same basic shape.
Notice the asymptotic nature of y = 2x and y = 3x as x approaches negative infinity, and y = 0.5x as x approaches positive infininty.
In each case, the y-values approach 0, but never = 0.
|
Exponential graphs show a rapid increase as x increases (for b > 1).
|
Properties of Exponential Functions: f (x) = abx |
|
|
The function f (x) = abx features:
• a domain of all real numbers, (-∞, ∞).
• a range of positive real numbers, (0,∞) assuming a > 0.
• a y-intercept at (0, a).
• a horizontal asymptote at y = 0 (the x-axis), when a > 0.
• a rapidly increasing graph when b > 1.
• a rapidly decreasing graph when 0 < b < 1.
• a graph that passes the vertical line test for functions.
• a graph that passes the horizontal line test for inverse function.
|
Parameters:
a = initial value, y-intercept
b = the base, the multiplier,
|
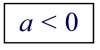
Note; If a < 0, the graph will reflect
over the x-axis.
|
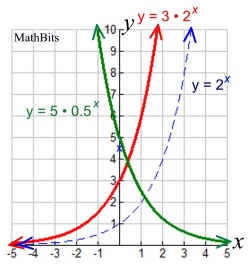
 The function f (x) = abx shows: The function f (x) = abx shows:
• exponential growth if a > 0 and b > 1, with growth factor b.
• exponential decay if a > 0 and 0 < b < 1. with decay factor b.
In both situations, (0, a) is the y-intercept, there is an asymptote at y = 0, the domain is all real numbers, and the range is y > 0
(unless a transformation has occurred).
Note: a > 0 when dealing with growth and decay.
|
A few pointers about "Intercepts" in exponential functions: |
|
|
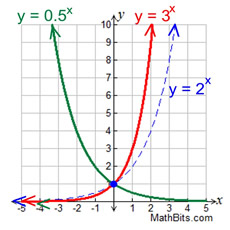
y = bx
 |
y = abx
 |
The parent function, y = bx, will always have a y-intercept of one, at (0,1). Algebraically speaking, when x = 0,
we have y = b0 which is always equal to 1.
There is no x-intercept with the parent function since the graph is asymptotic to
the
x-axis (approaches the x-axis but does not touch or cross it).
Note: In the parent function, a = 1. |
The general form of y = abx, will always have a y-intercept of a, at (0, a).
Again, algebraically speaking, when x = 0, we have
y = ab0 which is always equal to a • 1 or a.
Like the parent function, this general form will be asymptotic to the x-axis, and will have
no x-intercept.
Note: The value of "a" can be negative, which will reflect the graph over the x-axis. |
B U T . . . Transformations can change the game!!
If a transformed exponential function includes, for example, a vertical or horizontal shift, all bets are off. The horizontal shift will affect the y-intercept and the vertical shift will affect the possibility of an x-intercept. In these situations, you will need to examine the graph carefully to determine what is happening. |
 |
|
The End Behavior of Exponentials |
|
|
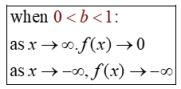
If a > 0, then y = bx and y = abx will be consistent.
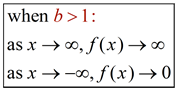
• if b > 1 (increasing function), the left side of the graph approaches zero, and the right side approaches positive infinity.
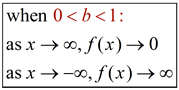
• if 0 < b < 1 (decreasing function), the right side of the graph approaches zero, and the left side approaches positive infinity.
|
|
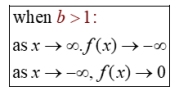
If a < 0, the general form y = abx will be consistent.
(The parent function y = bx is not considered.)
• if b > 1 (decreasing function), the right side of the graph approaches negative infinity and the left side approaches zero.
• if 0 < b < 1 (increasing function), the right side of the graph approaches zero and the left side approaches negative infinity.
|
 |
Note: The end behavior of an exponential graph may also depend on
whether a transformation of the graph has occurred.
If a transformation, such as a vertical shift, is applied to an exponential function, the end behavior will be affected. Consider the change in the location of the asymptote in this example:
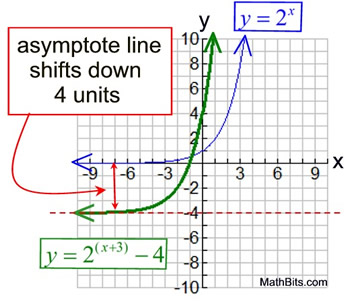
y = ab(x - h) + k |
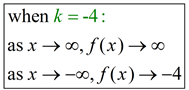
For the transformed equation y = 2(x+3) - 4,
the vertical shift of -4 will push the asymptote line down four units.
Thus the end behavior will be:
 FYI:
FYI: The y-intercept, where x = 0, is 4.
y = 2(0+3) - 4 = 8 - 4 = 4
The x-intercept, where y = 0, is -1.
0 = 2(x+3) - 4
4 = 2(x+3)
22 = 2(x+3)
x = -1
|
|
Need a
refresher for
graphing exponential
functions
click here. |
|
|

NOTE: The re-posting of materials (in part or whole) from this site to the Internet
is copyright violation
and is not considered "fair use" for educators. Please read the "Terms of Use". |
|
|