|
The features of a function graph can show us many aspects of the relationship represented by the function. Let's take a look at the more popular graphical features.
Be sure to pay attention to the vocabulary and the notation used in this section.
Intercepts are the locations (points) where the graph crosses (or touches)
either the x-axis or y-axis.
 To find the y-intercept, set x = 0,
and solve for y. To find the y-intercept, set x = 0,
and solve for y.
Remember: the
y-intercept will have an x-coordinate of 0.
y = f (x) = -2x + 2
y = -2(0) + 2; y = 2 y-intercept: (0,2)
(Yes, you can also read the y-intercept, b, from the function equation
if it is
in y = mx + b form.)
To find the x-intercept, set y = 0, and solve for x.
Remember: the x-intercept will have a y-coordinate of 0.
y = f (x) = -2x + 2
0 = -2x + 2; 2x = 2; x = 1 x-intercept: (1,0)
x-intercepts may also be referred to as "roots" or "zeros"
since they are where f (x) = 0. |
|

 |
 |
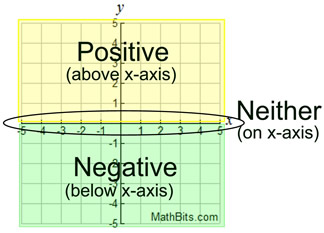
y-values positive
or
y-values negative |
Some functions are positive over their entire domain
(All y-values above the x-axis.)
 positive: -∞ < x < +∞
or "all Reals", or (-∞,+∞)
positive: -∞ < x < +∞
or "all Reals", or (-∞,+∞) |
Some functions are negative over their entire domain.
(All y-values below the x-axis.)
 negative: -∞ < x < +∞
or "all Reals", or (-∞,+∞)
negative: -∞ < x < +∞
or "all Reals", or (-∞,+∞) |
Some functions have both positive and negative regions.
(y-values above and below x-axis)
 positive:
x > 0 or (0,+∞)
negative: x < 0 or (-∞,0)
(do not include zero)
positive:
x > 0 or (0,+∞)
negative: x < 0 or (-∞,0)
(do not include zero) |
 |
Secret to Finding the Intervals!
The secret to correctly stating the intervals where a function is positive or negative is to remember that the intervals ALWAYS pertain to the locations of the x-values. Think of reading the graph from left to right along the x-axis.
Do NOT read numbers off the y-axis for the intervals. Stay on the x-axis!
|
 |
The discussion on this page will refer to "strictly" increasing and "strictly" decreasing. |
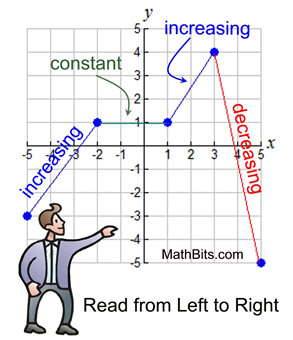
When looking for sections of a graph that are increasing or decreasing,
be sure to look at (or "read") the graph from left to right.
Increasing: A function is increasing, if as x increases (reading from left to right), y also increases . In plain English, from left to right, the graph goes up-hill.
The graph has a positive slope.
By definition: A function is strictly increasing on an interval, if when x1 < x2, then f (x1) < f (x2).
|
If the function notation is bothering you, this definition can also be thought of as stating x1 < x2 implies y1 < y2. As the x's get larger, the y's get larger.
Example: The function (graph) at the right is increasing from the point (-5,-3) to the point (-2,1), which is described as increasing when -5 < x < -2 .
Using interval notation, it is described as increasing on the interval (-5,-2).
|
|
It also increases from the point (1,1) to the point (3,4), described as increasing when 1 < x < 3.
Using interval notation, it is described as increasing on the interval (1,3). |
Decreasing: A function is decreasing, if as x increases (reading from left to right), y decreases. In plain English, from left to right, the graph goes down-hill.
The graph has a negative slope.
By definition: A function is strictly decreasing on an interval, if when x1 < x2,
then f (x1) > f (x2).
|
If the function notation is bothering you, this definition can also be thought of as stating x1 < x2 implies y1 > y2.
As the x's get larger the y's get smaller.
Example: The graph shown above is decreasing from the point (3,4) to the point (5,-5), described as decreasing when 3 < x < 5.
Using interval notation, it is described as decreasing on the interval (3,5).
Constant: A function is constant, if as x increases (reading from left to right), y stays the same. In plain English, from left to right, the graph goes flat (horizontal).
The graph has a slope of zero.
By definition: A function is constant, if for any x1 and x2 in the interval, f (x1) = f (x2). |
Example: The graph shown above is constant from the point (-2,1) to the point (1,1), described as constant when -2 < x < 1. The y-values of all points in this interval are "one".
Using interval notation, it is described as constant on the interval (-2,1).
|
Intervals of increasing, decreasing or constant ALWAYS pertain to x-values.
Do NOT read numbers off the y-axis.
Stay on the x-axis for these intervals!
|
Intervals of Increasing/Decreasing/Constant: Interval notation is a popular notation for stating which sections of a graph are increasing, decreasing or constant. Interval notation utilizes portions of the function's domain ( x-intervals). For the graph shown above, we would write:
The function is increasing on the x-intervals (-5,-2) and (1,3).
The function is decreasing on the x-interval (3,5).
The function is constant on the x-interval (-2,1). |
This is "open" interval notation. |
Differing notations for increasing intervals:
Regarding intervals of increasing or decreasing on a graph, it is a popular convention to use only "open" interval notation.
However, it is also considered correct to use either "open" or "closed" notation when describing intervals of increasing or decreasing.
References to ± infinity are always "open" notation.
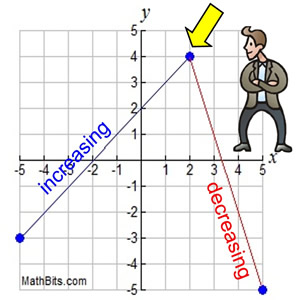
Take a look at the point (2,4) in the graph at the right. Does that point belong to the increasing interval? The decreasing interval? Both intervals? Neither interval?
|
|
Well, the answer may be both, neither, or a combination, depending upon the convention you are following. You may say "increasing on the interval (-5,2) or the interval [-5,2], or the interval (-5,2], or the interval [-5,2)." Just be consistent with the convention you are using.
Functions increase on intervals, not at points. The graph is neither increasing nor decreasing at the point (2,4). However, if a function increases on an "open" interval, then adding the endpoints will not change this fact (as long as the endpoints are in the domain).
This site will be using "open" interval notation to represent intervals of increasing and decreasing. Ask your teacher which notation convention is preferred in your classroom. |
|
For maximum/minimum, symmetry, and end-behavior, see More Function Features.
For continuous, roots, and multiplicity of roots, see Factoring and Graphing Polynomials.

NOTE: The re-posting of materials (in part or whole) from this site to the Internet
is copyright violation
and is not considered "fair use" for educators. Please read the "Terms of Use". |
|