|
When dealing with probability, every experiment has a set of possible outcomes, called the sample space. Probability is focused on the chance of one particular event occurring, in relation to the possible sample space.
If an event has only one possible outcome, the event is called a simple (or single) event.
If an event has more than one possible outcome, the event is called a compound event.
|
A sample space is the set of ALL possible outcomes for an experiment. |
|
When determining a sample space, you must be careful to include ALL possibilities.
This may become a difficult task when the sample space becomes very large.
Let's look at some do-able examples where outcomes are equally likely:
Activity/Experiment |
Sample Space as {lists} |
Tossing a Coin
(simple event)
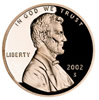 |
There will be 2 outcomes in the sample space.
{Heads, Tails} |
Rolling a Die
(simple event)
 |
There will be 6 outcomes in the sample space.
{1, 2, 3, 4, 5, 6} |
Draw a Card from a Standard Deck
(simple event) 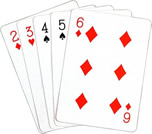 |
There will be 52 cards in the sample space:
{Spades: 2,3,4,5,6,7,8,9,10, ace, jack queen, king,
Clubs: 2,3,4,5,6,7,8,9,10, ace, jack, queen, king,
Diamonds: 2,3,4,5,6,7,8,9,10, ace, jack, queen, king,
Hearts: 2,3,4,5,6,7,8,9,10, ace, jack, queen, king} |
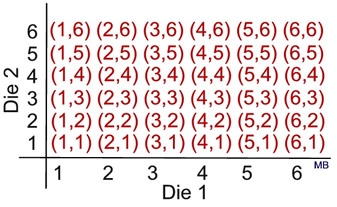
Rolling Pair of Dice
(compound event)
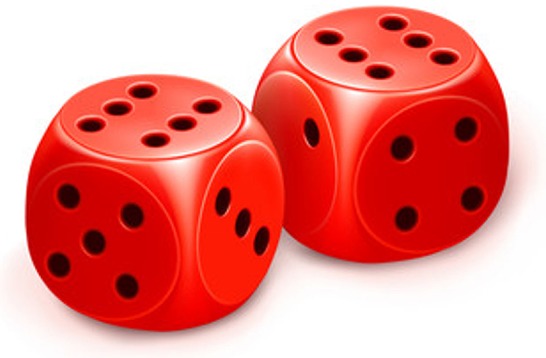 |
There will be 36 outcomes in the sample space:
{(1,1) (1,2) (1,3) (1,4) (1,5) (1,6),
(2,1) (2,2) (2,3) (2,4) (2,5) (2,6),
(3,1) (3,2) (3,3) (3,4) (3,5) (3,6),
(4,1) (4,2) (4,3) (4,4) (4,5) (4,6),
(5,1) (5,2) (5,3) (5,4) (5,5) (5,6),
(6,1) (6,2) (6,3) (6,4) (6,5) (6,6)} |
Choose Outfit
(compound event)
 |
An "outfit" will be a jacket, jeans, and footwear.
There will be 4 possible outfit combinations
in the sample space:
{brown jacket, jeans, boots;
brown jacket, jeans, sneakers;
red jacket, jeans, boots;
red jacket, jeans, sneakers}
|
The sample space examples shown above are presented as "lists" (rosters) using
French curly braces { } to denote "set". Sample spaces may also be listed as "charts".
The "chart" below represents an organized view of the sample space of rolling a pair of dice.
When performing an experiment, a sample space may appear in a "table" along with recorded hash marks to determine the frequency of the observations of each possible outcome in the sample space.
The table at the right shows possible outcomes from rolling a single die 20 times.
|
Roll of Die |
Frequency |
1 |
| | | | |
2 |
| | | |
3 |
| | | | |
4 |
| | | |
5 |
| | | | |
6 |
| | |
|

NOTE: The re-posting of materials (in part or whole) from this site to the Internet
is copyright violation
and is not considered "fair use" for educators. Please read the "Terms of Use". |
|