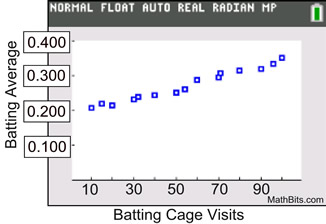
What is the slope of the linear regression line, and what does it tell us?
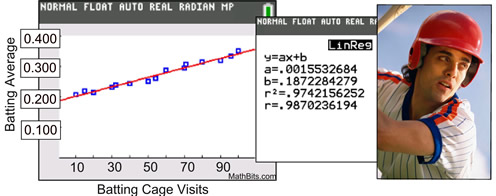
The slope is the "a" value from the calculator ( y = ax + b). The slope is 0.002.
It tells us that the for every batting cage visit, we can predict a seasonal batting average increase by 0.002.
What does the y-intercept represent?
The y-intercept is where x = 0. In this example, x = 0 stands for "no" visits to the batting cage.
The y-intercept predicts that the player who makes no visits to the batting cage will have a seasonal batting average of 0.187.
What seasonal batting average can we predict for a player who visists the batting cage 45 times in pre-season?
This question is asking us to interpolate, based upon the linear regression equation. Substitute 45 for x: y = 0.002(45) + 0.187. Batting average will be .277.
If a player wanted a batting average of .355, how many pre-season batting cage visists would have been required?
This question is asking us to extrapolate, based upon the linear regression equation. Substitute .355 for y and solve for x: .355 = 0.002x + 0.187. It would require 84 batting cage visits. |