|
Directions: These questions deal with box and whisker plots.
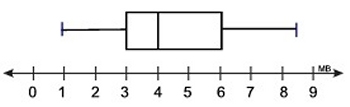
1. Given the box plot: 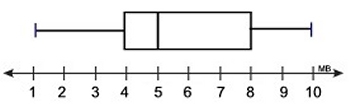
(a) What is the value of the third quartile?
(b) What is the value of the median?
(c) What is the range of the box plot?
(d) What is the interquartile range?
|
|
2. Examine box plot: 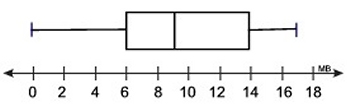 
(a) What percentage of the data is below the third quartile?
(b) Which of these intervals contains exactly 50% of the data?
(c) What percentage of the data is greater than 14?
(d) What percentage of the data is located between the first quartile and the median?
(e) What percentage of the data is above the median?
(f) Which of these intervals contains exactly 75% of the data?
|
|
3. Over the 10 weeks of summer vacation, Diego recorded the number
of hours he spent riding his new dirt bike each week.
Hours per week: 25, 27, 30, 29, 31, 26, 29, 30, 28, 34 |
 |
Which box and whisker plot represents this data?
Choose:
|
|
4. Raffle tickets were being sold in the month of September, prior to the Monster Truck Rally. The number of tickets sold, in hundreds, each day were recorded and displayed by the box plot below. |
  Determine whether the following statements are TRUE or FALSE regarding this box plot.
 |
| |
TRUE |
FALSE |
a) 25% of the data is between 300 and 400 |
|
b) the second quartile is 600 |
|
c) the median is 400 |
|
d) the first quartile is 300 |
|
e) the data range is 300 |
|
f) 50% of the data is between 300 and 600 |
|
g) the IQR is 300 |
|
h) 25% of the data is above the median |
|
|
|
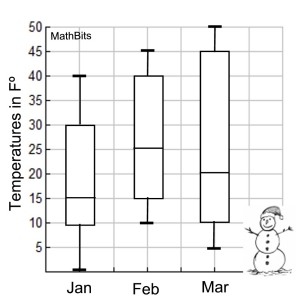
5. The box plots show the daily morning temperatures for the months of January, February and March in Upstate New York.
a) What is the average of the median temperatures over the 3 month span?
Choose:
b) Which month had the smallest interquartile range?
Choose:
|
|
c) Which month(s) could be described as having at least 25% of its temperatures over 30º?
Choose:
|
d) Which month(s) could be described as having 50% of its temperatures below 15º?
|
|
6. Consider the data below.
Data Set A : {12, 15, 15, 18, 18, 18, 19, 20, 21}
Data Box B : 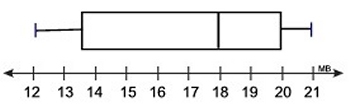 Determine which of the following statements are true.
| |
TRUE |
FALSE |
a) median of A = median of B |
|
b) range of A < range of B |
|
c) first quartile of A > first quartile of B |
|
d) third quartile of A < third quartile of B |
|
e) IQR of A = IQR of B |
|
f) maximum of A = maximum of B |
|
| g) minimum of A = minimum of B |
|
| h) Q2 of A = Q2 of B |
|
|
|

NOTE: The re-posting of materials (in part or whole) from this site to the Internet
is copyright violation
and is not considered "fair use" for educators. Please read the "Terms of Use". |
|