This page will examine graphing single variable inequalities
on a number line and on the coordinate axes.

NUMBER LINES
A real number line is a visual means of ordering the real numbers.
Inequalities illustrated on a number line allow for the visualization
of the solutions of the inequality.
|
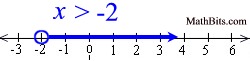
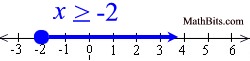
When graphing a linear inequality on a number line, use an open circle for "less than" or "greater than", and a closed circle for "less than or equal to" or "greater than or equal to". |
Inequalities displayed on number lines are easy to prepare and easy to read.
Three steps to develop an inequality graph on a number line:
1. Isolate the variable on one side of the inequality symbol.
2. If dealing with a strict inequality (> or <), start with an open circle plot.
If also dealing with equality (< or >), start with a closed circle plot.
3. Plot a thickened arrow in the direction determined by the inequality.
We have seen numerous examples of number line graphs on the pages Refresher
and Solving Linear Inequalities.
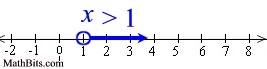
Graph the solution set of: 2x > x + 1 |
1. Isolate the variable to one side of the inequality.
(Subtract x from both sides)
2. Strict inequality = open circle to start
3. Determine arrow.
Greater than arrow moves to the right.
|
2x > x + 1
x > 1
|
COORDINATE AXES
If may seem like a strange idea, but single variable inequalities
can be graphed on coordinate axes.
Graph the solution set of: x > -4 in the coordinate plane. |
Start by graph the line x = -4.
Some sample points on this line will be
(-4,0), (-4, 2), (-4, 6), (-4, -4) , etc.
(any ordered pair where the
x-coordinate is -4. A vertical line.)
The line will be "dashed" since we are working with greater than (and NOT equal to).
Shade to the right of the line. Any ordered pair to the right of the line will have an
x-coordinate greater than -4. |
Graph of x > -4
x = 0 is greater than x = -4 |
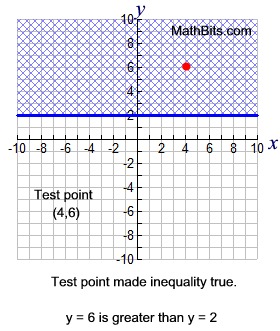
Graph the solution set of: y  2 in the coordinate plane. |
|
Start by graph the line y = 2.
Some sample points on this line will be
(0, 2), (-3, 2), (7, 2), (-6, 2) , etc.
(any ordered pair where the
y-coordinate is 2. A horizontal line.)
The line will be "solid" since we are working with greater than and equal to).
Shade above the line. Any ordered pair above the line (or on the line) will have a
y-coordinate greater than or equal to 2. |
|
|